CONSUMER MARKETING LIST PROFILING
Low-cost profile analysis can double ROI
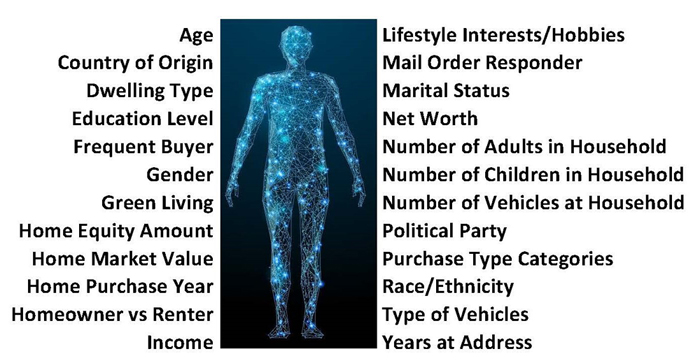
PROFILE ANALYSIS CORE BENEFIT: When ordering an email list, mailing list, or Facebook target, the slightest tweak with age, income, or other qualifiers can have a profound impact on ROI. Knowing which and how to tweak qualifiers is one major function and benefit of the Consumer Profile Analysis. The 100+ page profile analysis will provide a performance measure for 30+ key demographic qualifiers and 100+ lifestyle segments. These performance measures will tell the marketer the exact qualifiers to use when selecting their optimal target audience.

Lifestyles: CLICK HERE
Demographics: CLICK HERE
CONSUMER PROFILE ANALYSIS WILL INCLUDE FOLLOWING STATISTICAL MEASURES
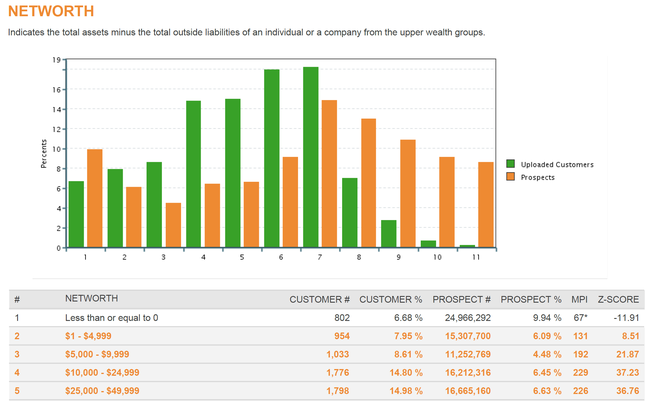
Customer Quantity: Number of customers with X attribute (income-X, age-X, lifestyle-X, etc)
Customer Percent: Percent of customers with X attribute
Market Quantity: Number of records within market with X attribute
Market Percent: Percent of records within market with X attribute
MPI Score (Market Penetration Index): MPI is a ratio that compares percent of households in customer file with specific attribute, and the percent of households in the reference population possessing the same attribute. An index of 100 means that the attribute is found as often within the customer file as it is within the total reference population. MPI values greater than 120 indicate attributes that are considerably over-represented, and MPI values less than 80 indicate attributes that are considerably under-represented. The difference between 100 and the computed MPI value indicates the extent of this over- or under-representation.
Z-Score: MPI values by themselves are not always sufficient. In some cases an attribute showing the highest MPI may prove statistically insignificant, for example, if the number of records with this attribute is very small. Z-Score is a way to ensure that the MPI deviations do not occur by chance. Rather than comparing raw percents, Z-Scores take relative proportions into account and heavily depend on the size of the file being analyzed. The larger the Z-Score value (positive or negative), the more statistically valid is the MPI result. Any attribute with a Z-Score between -3 and 3 is considered statistically insignificant, whether the MPI is high or not.

MEASURE/COMPARE LEAD GENERATION SOURCES
Often its advantageous to generate a consumer profile report for “each” lead generation source, and then combine the results from all reports into one master report. For example, which lead generation source (Facebook, AdWords, Direct Mail, Website Visitor Capture, Google Display Ads, etc) generates leads that most resemble the typical buyer? Of course, the answer to this key question can have a significant impact on marketing strategies … re-allocating ad dollars from one lead source to another. On a side note, YES … pricing discounts apply when ordering multiple profile reports.
80/20 RULE:
For many companies 80% of revenue comes from just 20% of their customers, and very likely this rule applies to your business. The Consumer Profile Analysis can help you identify the 20% group.
DON’T BE FOOLED BY CUSTOMER PERCENT:
The most common error novice marketers make is concluding that X group represents the best leads since X group constitutes the highest percentage of customers. Per below example, majority of customers fall in the “High School” group, thus mistakenly the marketer concludes that non-college graduates must represent the best leads. What the marketer is not realizing is that majority of the population is without a college degree so it’s common for an over-proportionate of file to consist of people without a college degree. However, with a closer look at the MPI Score – the marketer can see that people with a “Graduate Degree” are significantly out-performing the “High School” group.

